See GitHub commits driving traffic and revenue
See your GitHub commits directly on your analytics chart to understand which product updates move the needle.
Connect product development to business results
- Link features to revenue - See which code changes correlate with sales increases
- Find what moves the needle - Identify which product updates drive the most engagement
- Time your launches - Spot patterns between releases and traffic spikes
How it works
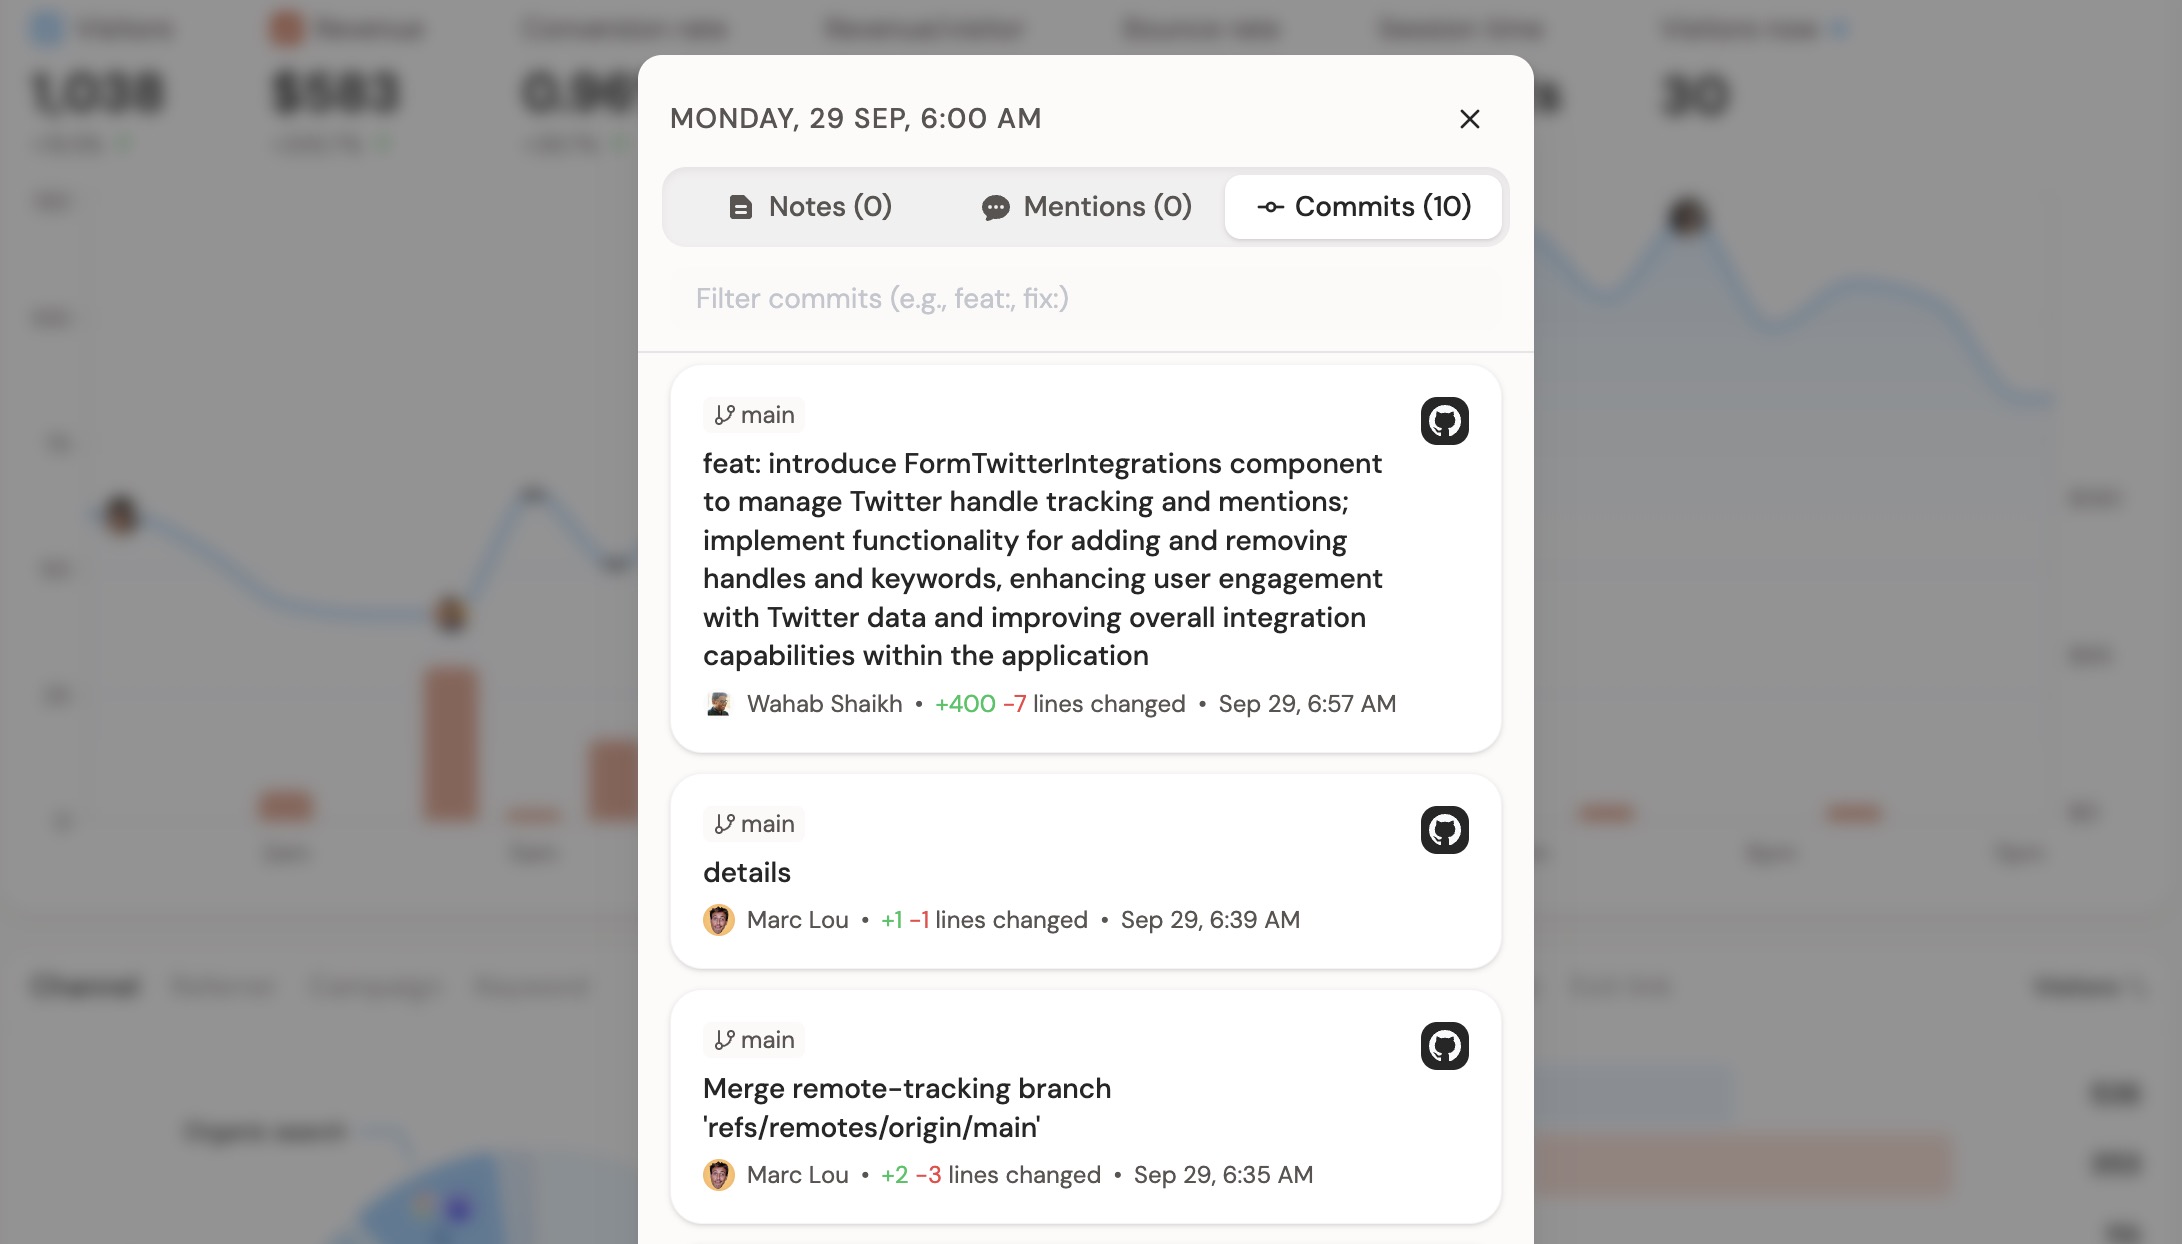
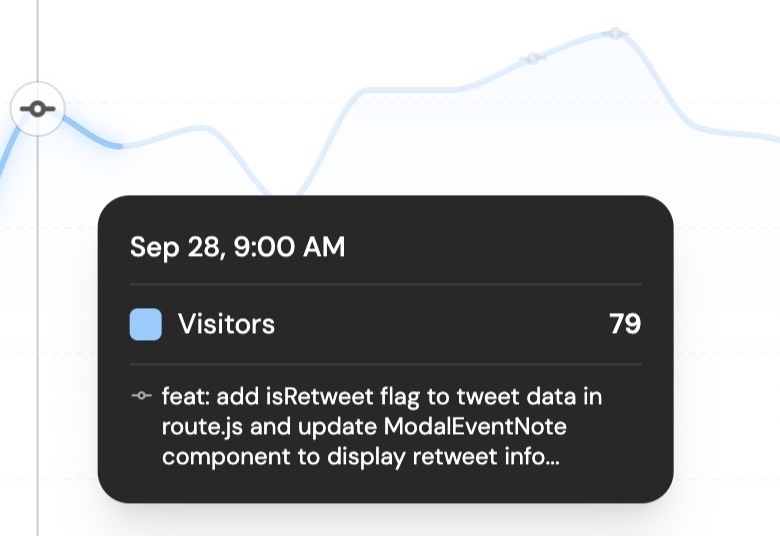
When you push commits to your connected repository, DataFast automatically displays them on your analytics chart. You'll see:
- Commit messages aligned with traffic and revenue data
- Author information and line changes (+/- stats)
- Branch names and timestamps
- Filters to focus on specific types of commits (e.g.,
feat:,fix:)
Set up GitHub integration
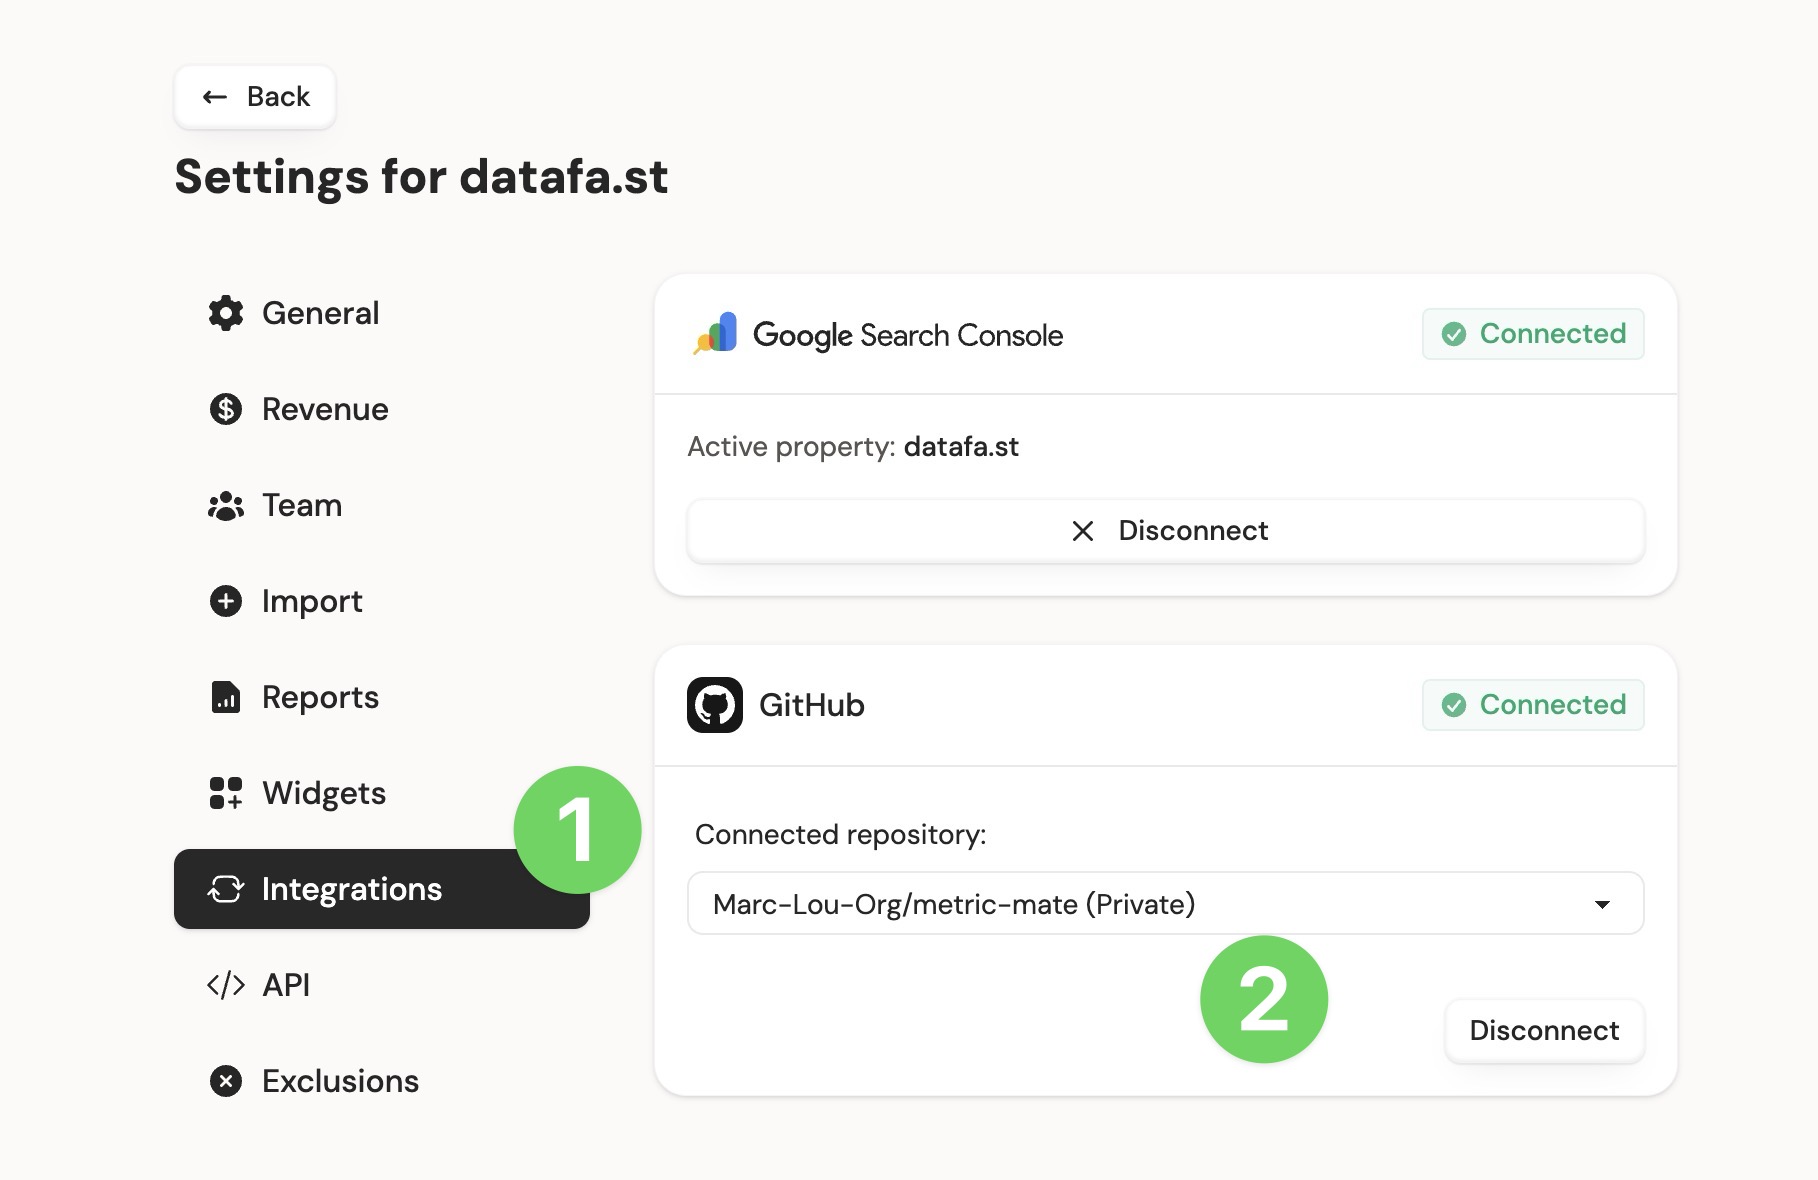
- Go to your Website Settings > Integrations
- Find the GitHub section
- Click Install GitHub App
- Select your repository from the dropdown
- DataFast syncs your commit history automatically
Requirements
- GitHub account (personal or organization)
- Admin access to the repository you want to track
- One repository per website
DataFast requires minimal permissions to track commits. We don't even read the code, just the commit messages and a few metadata (see "What gets tracked" section).
What gets tracked
- Commit messages - See what changed
- Author info - Who made the commit
- Line changes - +/- additions and deletions
- Branch - Which branch the commit is on
- Timestamp - When it was committed