A visitor who comes back is giving you a different signal than someone landing for the first time. New visitors show acquisition. Returning visitors show interest, habit, research, or purchase intent.
Why this matters
If a channel sends mostly first-time visitors, it may be good for awareness. If it sends people who return, revisit pricing, and complete goals, it may be better for growth. Splitting new vs returning visitors helps you see whether a launch, SEO page, ad, or newsletter is creating a one-day spike or bringing people back.
Why most analytics tools can't tell you
Most dashboards show one visitor number. You can see traffic go up, but not whether those people are discovering you for the first time or coming back for another session. That makes retention and intent harder to read from the main chart.
How DataFast does it
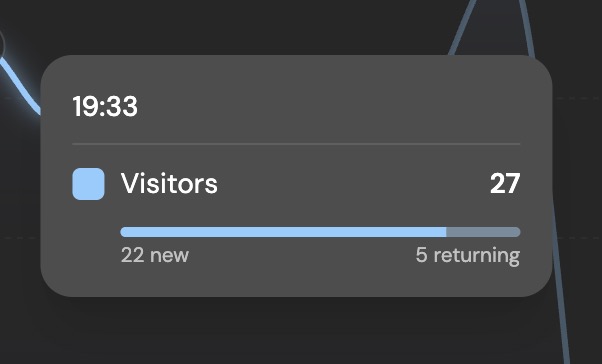
DataFast tracks the visitor's session count with the standard tracking script. The main visitor chart can split traffic into new visitors and returning visitors, and the same visit count can be used as a dashboard filter.
How to do it
- Use the standard DataFast tracking script on every page
- Open your dashboard and click Visitors to compare new vs returning traffic over time
- Add a visit count filter, for example 2 or more visits, to focus the whole dashboard on returning visitors
- Compare Source, Pages, Countries, Devices, Goals, Journeys, and Funnels for that returning segment
Returning visitors are usually the best segment to inspect when you want to understand repeat interest. For API or CLI work, use filter_visit_count=gte:2 to focus on visitors with at least two tracked sessions.